Examples for vector fields and potentials
Contents
You need to download new m-files.
Download the files vectorfield.m, vectorfield3.m, ezisosurf.m, ezpcolor.m, posneg.m
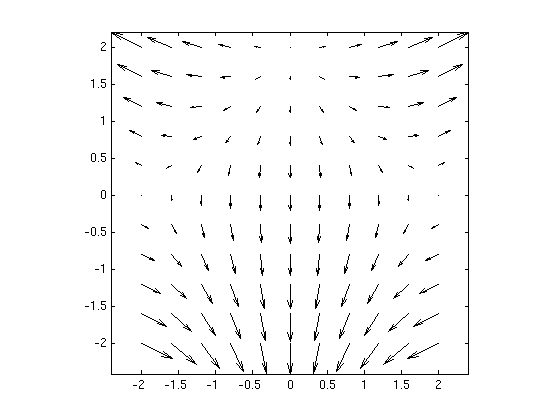
(1a) Plot a 2D vector field
Plot the 2D vector field F = ( 2*x*y , x^2+2*y-4 ) for x,y in [-2,2].
syms x y real
F = [ 2*x*y , x^2+2*y-4 ];
vectorfield(F,-2:.4:2,-2:.4:2)
(1b) Find a potential f(x,y) for the vector field F
For the vector field F from (1a) find a potential f(x,y). Check that grad f = F.
Plot the vector field together with the contour plot of the potential. How can you see geometrically that the potential fits to the given vector field?
Answer: We can see that F is the gradient of f: The vector field is orthogonal on the contour curves, and the vectors point towards higher values of f.
f = potential(F,[x y])          % find potential with respect to variables (x,y)
simplify(jacobian(f,[x y]) - F) % gives zero

% We use jacobian(f,[x y]) to compute gradient, since this gives row vector.
% Using gradient(f,[x y]) gives a column vector.

vectorfield(F,-2:.4:2,-2:.4:2); hold on
ezcontourc(f,[-2 2 -2 2],30); colorbar; hold off
title('Vector field F with contours of potential f')
f =
y*x^2 + y*(y - 4)
ans =
[ 0, 0]

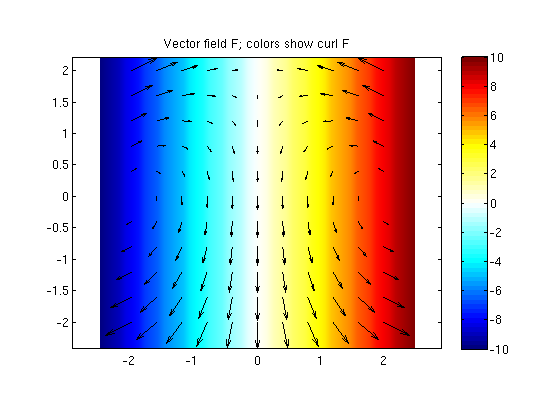
(2) Try to find a potential for vector field F = ( -2*x*y , x^2+2*y-4 ).
First find the curl of the vector field. How do the values of curl F correspond geometrically to the vector field?
Answer: We find that curl F = (0,0,4*x) is nonzero, hence the potential does not exist.
We see that the curl is positive for x>0 and negative for x<0. Imagine that the arrows describe a fluid flow. Then an object held at a position with positive x will be rotated counterclockwise. An object held at a position with negative x will be rotated clockwise.
syms x y z
F = [ -2*x*y , x^2+2*y-4 ];
f = potential(F,[x y])          % Matlab returns "NaN" which means there is no answer

G = curl([F,0],[x y z])         % check the curl: use [F,0] since we need vector of 3 components

vectorfield(F,-2:.4:2,-2:.4:2); hold on
ezpcolor(G(3),[-2.5 2.5 -2.5 2.5]); colorbar; hold off
colormap(posneg)
title('Vector field F; colors show curl F')
f =
NaN
G =
   0
   0
 4*x
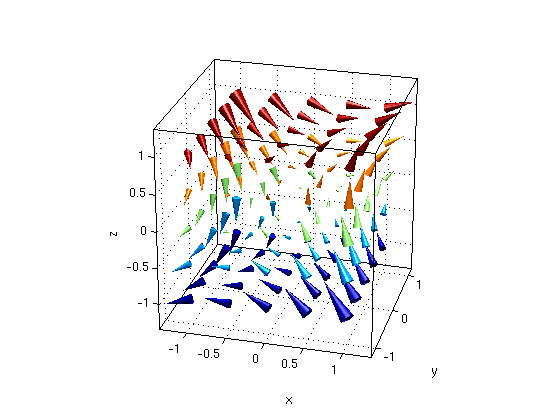
(3) Find potential for 3D vector field F
Consider the vector field F = ( y+2*z, x-z, 2*x-y ). Find curl F. Find a potential f if possible.
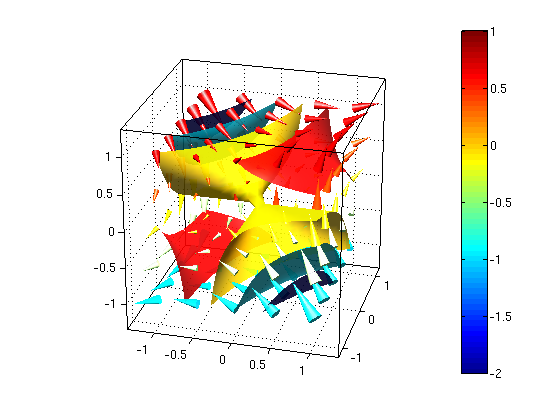
Plot the vector field together with the contour plot of the potential. How can you see geometrically that the potential fits to the given vector field?
Answer: We can see that F is the gradient of f: The vector field is orthogonal on the contour surfaces, and the vectors point towards higher values of f.
syms x y z real
F = [ y+2*z, x-z, 2*x-y ];
G = curl(F,[x y z])                          % curl F is zero
f = potential(F,[x y z])

figure(1)                                    % Plot vector field F
vectorfield3(F,-1:.5:1,-1:.5:1,-1:.5:1); view(15,25)

figure(2)                                    % Plot vector field F together with contours of potential f
vectorfield3(F,-1:.5:1,-1:.5:1,-1:.5:1); hold on
ezisosurf(f,[-1 1 -1 1 -1 1],-2:1);          % Plot contour surfaces for f=-2,-1,0,1
colorbar;
alpha(0.9); hold off; view(15,25);
G =
 0
 0
 0
f =
x*(y + 2*z) - y*z