MATH/CMSC 206 - Introduction to Matlab
| Announcements | Syllabus | Tutorial | Projects | Submitting |
Answers to Self-Test
1. This will require a for loop and an if. Something like this will do the trick.
| function y=adjust(v) for i=[1:length(v)] if (v(i) > 0) w(i) = v(i)^2; elseif (v(i) < 0) w(i) = -sqrt(-v(i)); else w(i) = v(i); end; |
2. The function M-file would be something like this:
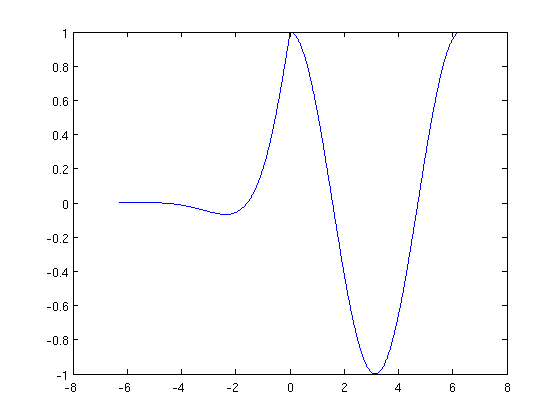
| function y=piece(v) for i=[1:length(v)] if (x(i) >= 0) w(i) = cos(x(i)); else w(i) = exp(x(i))*cos(x(i)); end; end; y=w; |
Then here is the function in action:
X=[-2*pi:0.01:2*pi];
plot(X,piece(X))
3. This question was more about making sure you know how to document your M-file rather than write it. The function itself is fairly straightforward:
| function y=exparea(a,b) % This function finds the area below e^x from x=a to x=b, where a % and b are the parameters passed. y=int(exp(x),a,b); end; |
4. This is not overly difficult:
| function l=badlimit(f,x) l=f(x+0.0001); end; |