MATH/CMSC 206 - Introduction to Matlab
| Announcements | Syllabus | Tutorial | Projects | Submitting |
Answers to Self-Test
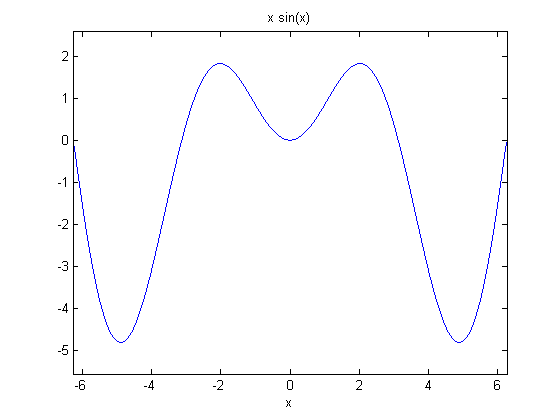
1. Have you ever wondered what the graph of the function f(x) = x * sin(x) looks like? Of course you have. Find out using ezplot.
syms x
ezplot(x * sin(x))
2. Suppose you want to find the solutions to the equation 5*x^2 - 125*ln(x) = 0. First try to solve this equation symbolically, using "solve". How do you like them apples?
solve(5 * x^2 - 125 * log(x))
ans =

1/exp(wrightOmega(log(2/25) + pi*i)/2)
I have no idea what wrightOmega is, do you?
3. OK, it looks like you'll probably want to try a numerical method for solving that crazy equation in the previous question. In order to use fzero, you'll need to start with an initial estimate -- but how do you know what value to choose? Use ezplot to draw a graph of this function. Try different ranges until you can see approximately where this graph crosses the x-axis. Now solve the equation with fsolve using the estimated "zero" obtained visually from the graph.
ezplot(5 * x^2 - 125 * log(x))
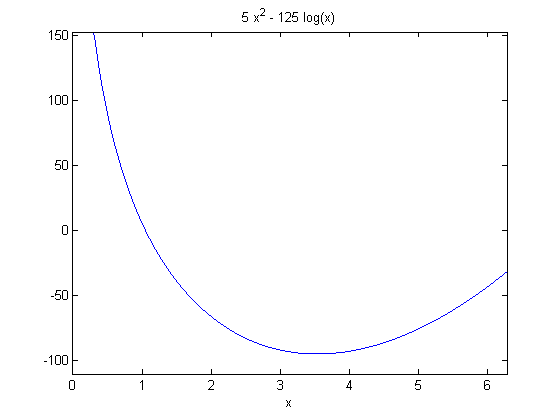
OK, I see that there is a zero someplace near x = 1, so we'll try that as an initial value:
fzero(@(x) 5 * x^2 - 125 * log(x), 1)
ans =

    1.0446