Contents
First Thing.
The previous line begins with %% followed by some text. When published this will show up as a distinct section with its own label in the html document. Now here is a calculation:
2+2
ans =

     4
The previous line just has %% but no text. It's still critical to have it there because we're beginning a section of text. It will NOT have a label though. You can't just go from Matlab code straight back to %, you need to have %% first. Now here's some other stuff:
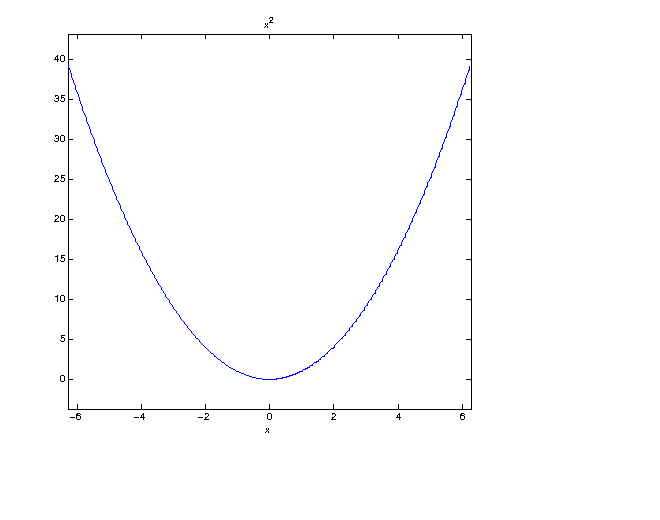
syms x;
ezplot('x^2')
A New Section Label
Back to text with another %% but now a section label again because it's %% plus the label.
Notice that we can have % by itself which just begins a new paragraph within the text section.
Here are some italics and here is some boldface. Here is some fixed-width font which looks like code.
Here's another calculation:
solve('2*x+3')
ans =

-3/2
Now back to text. We can do some numbering but before the numbering we must have a line with %% or just a simple %.
- One
- Two
- Three
A simple % line ends the counting. Here is another calcuation:
diff('sin(x^2)')
ans =

2*x*cos(x^2)
Now if we go back to text and try more numbers they restart at
- One
- Two
The thing is that the # symbol will do numbering but only if they're in the same text section.
Finally here are some bullets, again preceeded by %:
- Bam!
- Kapow!
Done!