Examples Wednesday, Feb. 19
Contents
You need to download new m-files.
Download the files defaultlighting.m, surfcontour.m, ezpcolor.m, colorposneg.m, ezisosurf.m.
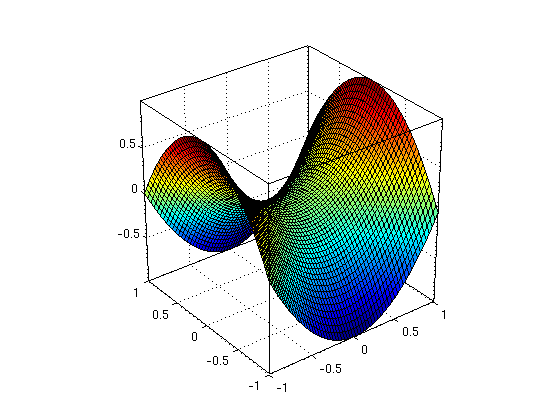
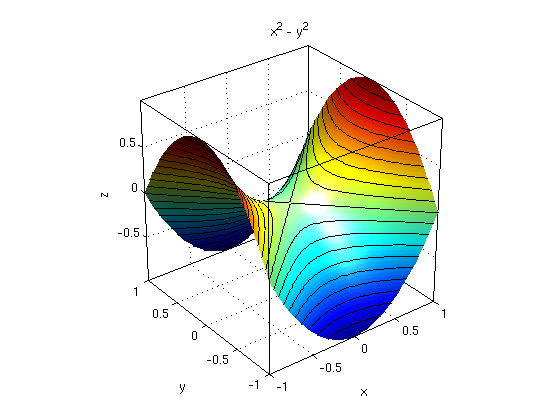
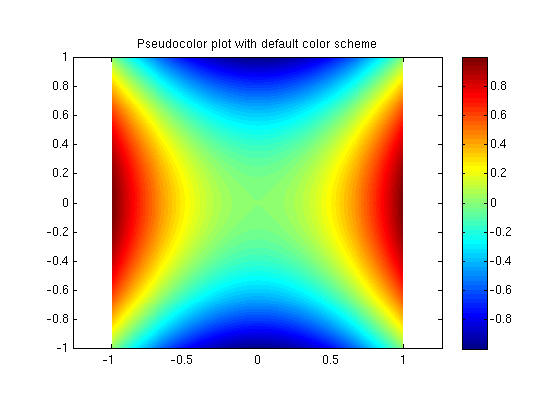
Graph for function f(x,y)
ezsurf makes graph with grid, color corresponds to z-value
surfcontour replaces grid with contour curves.
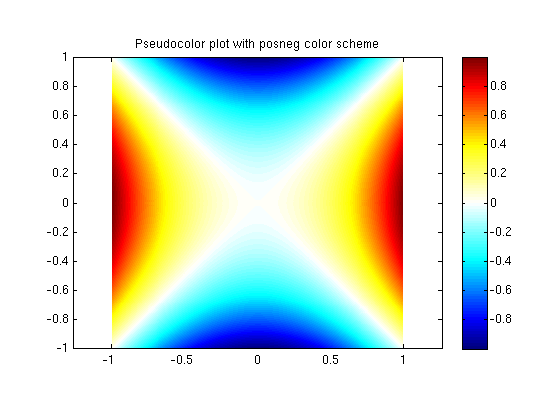
ezpcolor shows the function values in the xy-plane using colors. The default color scheme uses red for the hightest value, blue for the lowest value and green for intermediate values.
colorposneg switches to a color scheme which makes it easier to see positive and negative values: It shows zero values white, positive values yellow & red, negative values green & blue
syms x y real                 % define x,y as real symbolic values
f = x^2 - y^2;
figure(1)                     % 1st figure in cell
ezsurf(f,[-1 1 -1 1])         % plot graph for x=-1...1, y=-1...1
nice3d

figure(2)                     % 2nd figure in cell
ezsurf(f,[-1 1 -1 1])
nice3d
defaultlighting               % illuminate with default lights
surfcontour                   % add contours to surface (instead of grid)

figure(3)                     % 3rd figure in cell
ezpcolor(f,[-1 1 -1 1]); colorbar  % ezpcolor gives "Pseudocolor plot" (just colors, no contours)
title('Pseudocolor plot with default color scheme')

figure(4)                     % 4th figure in cell
ezpcolor(f,[-1 1 -1 1]); colorbar
colorposneg                   % color scheme which shows zero values white, positive values yellow & red,
                              %   negative values green & blue
title('Pseudocolor plot with posneg color scheme')
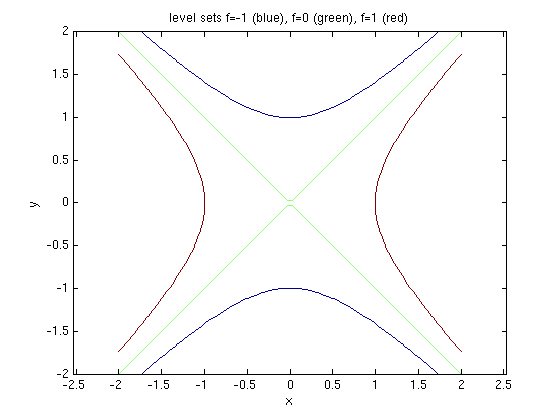
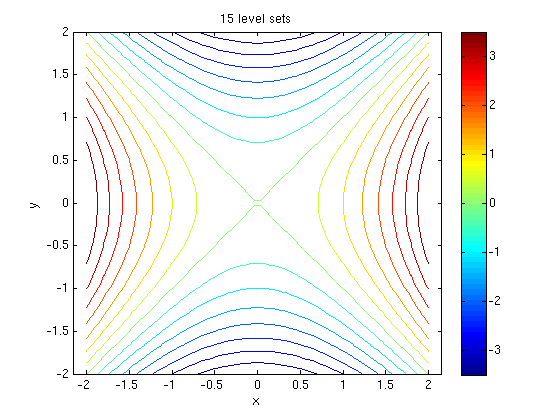
Level sets (curves) for function f(x,y)
ezcontourc(f, [xmin,xmax,ymin,ymax], [c1,c2,...,cn]) shows level curves for f=c1,...,f=cn (n must be at least 2)
ezcontourc(f, [xmin,xmax,ymin,ymax], n) shows n level curves (with equidistant values c1,...,cn).
figure(1)                      % 1st figure in cell
ezcontourc(f,[-2 2 -2 2],[-1 0 1]); axis equal
title('level sets f=-1 (blue), f=0 (green), f=1 (red)')

figure(2)                      % 2nd figure in cell
ezcontourc(f,[-2 2 -2 2],15); colorbar; axis equal
title('15 level sets')
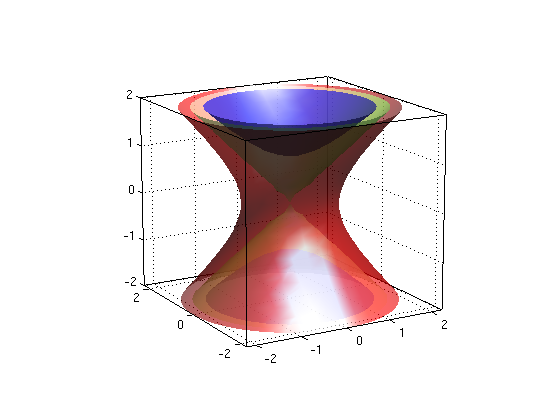
Level sets (surfaces) for function f(x,y,z)
To plot level surfaces of points with f(x,y,z)=c use
- ezisosurf(f,[x1,x2,y1,y2,z1,z2],[f1,...,fn])
where [x1,x2], [y1,y2], [z1,z2] are the intervals for x,y,z and f1,...,fn are the f-vaues for which we want to plot the surfaces.
Here we plot the level surfaces for
- f=-1 (blue): hyperboloid of two sheets
- f=0 (green): double cone
- f=1 (red): hyperboloid of one sheet
syms x y z real
f = x^2 + y^2 - z^2;
ezisosurf(f,[-3 3 -3 3 -2 2],[-1 0 1])  % show level sets for f=-1,0,1
nice3d; alpha(0.6)                      % make transparent with alpha(...)
view(-30,15)