Examples Friday, March 14: Lagrange Multipliers
Contents
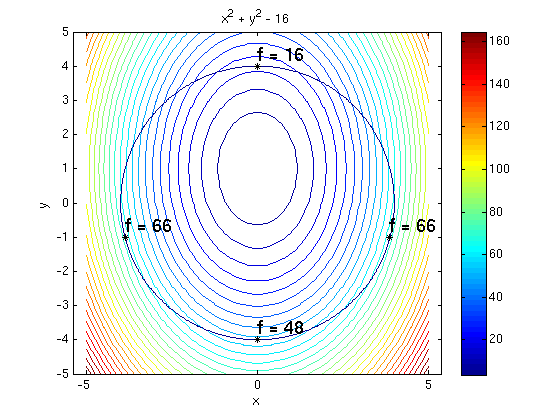
(a) Find the maximum and the minimum of the function f(x,y)=4*x^2+2*y^2-4*y on the curve given by x^2+y^2=16. Give the value and the location of the maximum and minimum.
Answer: The maximum of the function f on the curve is 66, it is attained at the points (-sqrt(15),-1) and (sqrt(15),1). The minimum of the function f on the curve is 16, it is attained at the point (0,4).
syms x y lambda real
f = 4*x^2 + 2*y^2 - 4*y;
g = x^2 + y^2 - 16;            %  we define g(x,y) so that the constraint is g(x,y)=0
fx = diff(f,x)
fy = diff(f,y)
gx = diff(g,x)
gy = diff(g,y)
s = solve(fx-lambda*gx,fy-lambda*gy,g,x,y,lambda);  % solve the system of 3 equations
[s.x,s.y]                      % s.x is vector of x-values, s.y is vector of y-values
                               % here we get four solutions
fs = subs(f,{x,y},{s.x,s.y})   % plug each solution in function f
                               % fs is vector of four function values
% Matlab can't find max/min of symbolic values, so we need "double" to convert to machine numbers
fsd = double(fs);
fmax = max(fsd)                % maximum
fmin = min(fsd)                % minimum

ezcontourc(f,[-5,5,-5,5],31);  % contour plot of f
colorbar; hold on
ezplot(g,[-5,5,-5,5]);         % plot where g=0
plotpts([s.x,s.y],'k*')        % mark critical points with black asterisk
for i=1:length(s.x)
  P = [s.x(i),s.y(i)];               % critical point number i
  texts(P,sprintf('f = %g',fsd(i)')) % print 'f=...' at each critical point
end
hold off; axis equal;
fx =
8*x
fy =
4*y - 4
gx =
2*x
gy =
2*y
ans =
[         0,  4]
[         0, -4]
[  15^(1/2), -1]
[ -15^(1/2), -1]
fs =
 16
 48
 66
 66
fmax =
    66
fmin =
    16
(b) Plot the following together:
- the curve given by g(x,y)=c
- the contours of the function f
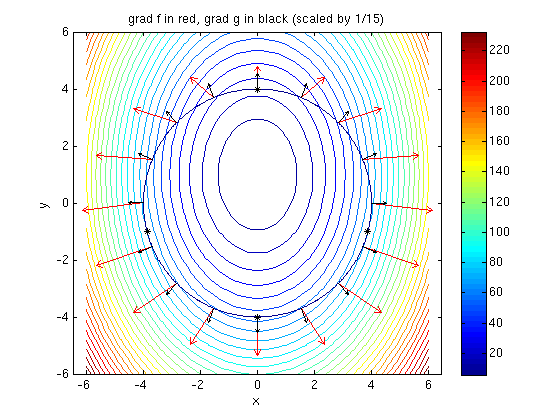
- the gradient of the function f (in red) and g (in black) for a couple of points on the curve
- the critical points marked by asterisks
Explain how you can see from grad f and grad g in which direction the value of f increases along the curve.
Answer: The vector grad f, projected onto the tangent of the curve, points in the direction where f is increasing along the curve.
The vector w = grad f can be decomposed w = w_par + w_orth where w_par is parallel to grad g, and w_orth is orthogonal on grad g. Then the vector w_orth points in the direction where f is increasing along the curve.
If the vector grad f is parallel to the vector grad g, we have a critical point of the function f on the curve.
ezcontourc(f,[-6,6,-6,6],31);  % contour plot of f
colorbar; hold on
ezplot(g,[-6,6,-6,6]);         % plot where g=0
plotpts([s.x,s.y],'k*')        % mark critical points with black asterisk
for t=(1:16)/16*2*pi           % for 16 t-values in [0,2*pi]
  xt = 4*cos(t); yt = 4*sin(t);
  gradf = subs([fx,fy],{x,y},{xt,yt});
  gradg = subs([gx,gy],{x,y},{xt,yt});
  arrow([xt,yt],gradf/15,'r')  % we use a factor 1/15 for plotting the gradient vectors
  arrow([xt,yt],gradg/15,'k')
end
hold off; axis equal;
title('grad f in red, grad g in black (scaled by 1/15)')