Example for Green's theorem: curl and divergence version
Contents
- You need to download new m-files.
- (1) Consider a 2D vector field in a circle
- (2a) Find the work integral W for the vector field F and the curve C.
- (2b) Find the work integral W by using Green's theorem.
- (3a) Find the flux integral for the vector field F and the curve C.
- (3b) Find the flux integral by using Green's theorem
You need to download new m-files.
Download the files vectorfield.m, ezpcolor.m, colorposneg.m
(1) Consider a 2D vector field in a circle
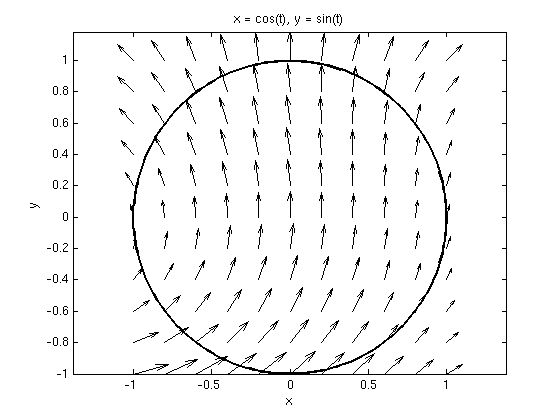
The vector field is F = ( -y*(1-x-y)+x/4, 2-x^2+y/4 ), the region R consists of the points (x,y) with x^2+y^2<=1. Let C be the boundary curve (counterclockwise). Find a parametrization of C. Plot the vector field together with C.
syms x y z t real
Pi = sym('pi');
F = [ -y*(1-x-y)+x/4, 2-x^2+y/4 ];       % vector field F
vectorfield(F,-1:.2:1,-1:.2:1); hold on  % plot vector field
X = cos(t); Y = sin(t);                  % parametrization r=[X,Y] of curve
P = ezplot(X,Y,[0,2*pi]);                % plot curve
set(P,'Color','black','LineWidth',2)     % make curve black, thicker
hold off
(2a) Find the work integral W for the vector field F and the curve C.
Answer: The work integral is W = pi.
Fr = subs(F,{x,y},{X,Y})                 % substitute curve parametrization in F
rp = diff([X,Y],t)                       % velocity vector
W = int(dot(Fr,rp),t,0,2*Pi)
Fr =
[ cos(t)/4 + sin(t)*(cos(t) + sin(t) - 1), sin(t)/4 - cos(t)^2 + 2]
rp =
[ -sin(t), cos(t)]
W =
pi
(2b) Find the work integral W by using Green's theorem.
Use polar coordinates. Make a plot of the vector field together with the 3rd curl component.
Answer: We again obtain W = pi.
G = curl([F,0],[x y z])                 % need vector field of 3 components for curl
g = G(3)                                % 3rd component of curl

syms r theta real
X = r*cos(theta); Y = r*sin(theta);     % polar coordinates
gr = subs(g,{x,y},{X,Y})                % substitute polar coordinates for x,y in g
W2 = int(int(gr*r,r,0,1),theta,0,2*Pi)  % integrate gr*r*dr*dtheta
                                        % gives same result as (2a)!

vectorfield(F,-1:.2:1,-1:.2:1); hold on % plot vector field
P = ezplot(cos(t),sin(t),[0,2*pi]);     % plot curve
set(P,'Color','black','LineWidth',2)
ezpcolor(g,[-1.2 1.2 -1.2 1.2]); hold off % plot 3rd curl component
colorbar; colorposneg
title('colors show curl: blue is clockwise, red is counterclockwise')
G =
             0
             0
 1 - 2*y - 3*x
g =
1 - 2*y - 3*x
gr =
1 - 2*r*sin(theta) - 3*r*cos(theta)
W2 =
pi

(3a) Find the flux integral for the vector field F and the curve C.
Answer: The flux integral is pi/2.
X = cos(t); Y = sin(t);                 % parametrization r=[X,Y] of curve
Fr = subs(F,{x,y},{X,Y})                % substitute curve parametrization in F
Xp = diff(X,t); Yp = diff(Y,t);         % find X',Y'

I = int(dot(Fr,[Yp,-Xp]),t,0,2*Pi)      % integrate F(r(t))*[Y',-X'] (dot product)
Fr =
[ cos(t)/4 + sin(t)*(cos(t) + sin(t) - 1), sin(t)/4 - cos(t)^2 + 2]
I =
pi/2
(3b) Find the flux integral by using Green's theorem
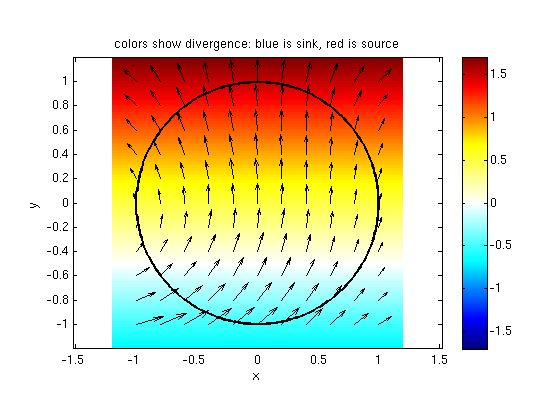
Use polar coordinates. Make a plot of the vector field together with the divergence.
Answer: We again obtain pi/2 for the flux integral.
g = divergence(F,[x y])                 % find the divergence of F
syms r theta real
X = r*cos(theta); Y = r*sin(theta);     % polar coordinates
gr = subs(g,{x,y},{X,Y})                % substitute polar coordinates for x,y in g
I2 = int(int(gr*r,r,0,1),theta,0,2*Pi)  % integrate gr*r*dr*dtheta
                                        % gives same result as (3a)!

vectorfield(F,-1:.2:1,-1:.2:1); hold on    % plot vector field F
P = ezplot(cos(t),sin(t),[0,2*pi]);        % plot the curve
set(P,'Color','black','LineWidth',2)
ezpcolor(g,[-1.2 1.2 -1.2 1.2]); hold off  % plot divergence
colorbar; colorposneg
title('colors show divergence: blue is sink, red is source')
g =
y + 1/2
gr =
r*sin(theta) + 1/2
I2 =
pi/2