Examples Monday, Febr. 3
Contents
Volume of parallelepiped
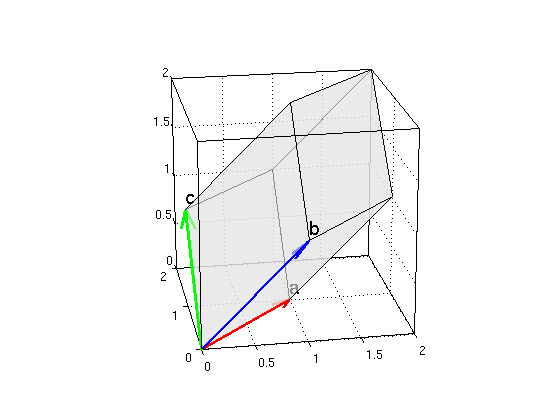
A parallepiped has a vertex (0,0,0) and vectors a = (1,1,0), b=(1,0,1), c = (0,1,1). Find the volume and plot the parallelepiped.
a = [1,1,0]; b = [1,0,1]; c = [0,1,1];
determinant = det([a;b;c])           % note that vectors a,b,c have negative orientation
volume = abs(determinant)

gray = [.9 .9 .9];
parallelepip([a;b;c],gray); alpha(0.6) % make transparent
nice3d; hold on
or = [0,0,0];
arrow3(or,a,'r'); texts(a,'a');
arrow3(or,b,'b'); texts(b,'b');
arrow3(or,c,'g'); texts(c,'c');
hold off
view(-10,20)                         % pick nice angle to look at plot
determinant =
    -2
volume =
     2

Distance of point to line
Consider the line through the points P = (-1,2,3) and Q = (2,5,6). For the point R = (2,3,1) find the closest point S on the line. Find the distance of the points R and S.
Then compute the distance of the point R to the line using the formula with the cross product and check that you get the same value.
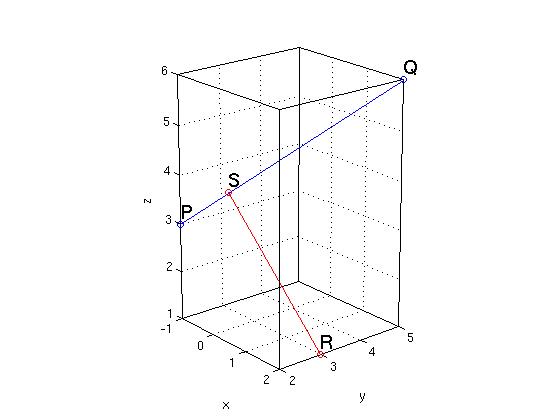
Make a graph which shows the line and the points P,Q,R,S.
P = [-1,2,3]; Q = [2,5,6]; R = [2,3,1]
L = Q - P                            % direction vector L of line
d = R - P                            % vector from P to R
dpar = dot(L,d)/dot(L,L)*L           % projection of d onto L
S = P + dpar                         % S is closest point to R
distance1 = norm(R-S)                % Method 1: distance of points R,S
distance2 = norm(cross(L,d))/norm(L) % Method 2: formula with cross product

plotpts([P;Q],'o-');                 % plot line thru P,Q, mark pts with 'o'
hold on                              % add to the current plot
plotpts([R;S],'ro-');                % plot points R,S (connected by red line)
texts(P,'P'); texts(Q,'Q');          % label points
texts(R,'R'); texts(S,'S');
hold off; nice3d
view(50,20);                         % pick nice angle to look at plot
R =
     2     3     1
L =
     3     3     3
d =
     3     1    -2
dpar =
    0.6667    0.6667    0.6667
S =
   -0.3333    2.6667    3.6667
distance1 =
    3.5590
distance2 =
    3.5590
