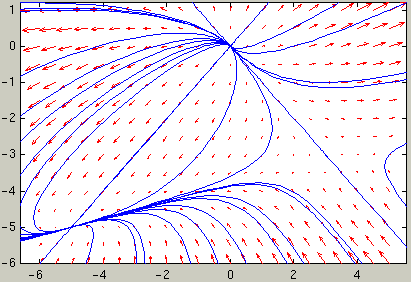
vectfield(g,-6:.5:5,-6:.5:1)
hold on
for a1=-7:2:5
for a2=-7:2:1
[ts,ys] = ode45(g,[0,4],[a1;a2]);
plot(ys(:,1),ys(:,2))
[ts,ys] = ode45(g,[0,-4],[a1;a2]);
plot(ys(:,1),ys(:,2))
end
end
hold off

First download the file vectfield.m .
Here we consider the following example of an autonomous system:
y1' = 4y1 + y2 + y1 y2
y2' = y1 + 4 y2 + y22
First define the right hand side function
g of the differential equation as
g = inline('[4*y(1)+y(2)+y(1)*y(2) ;
  y(1)+4*y(2)+y(2)^2]','t','y')
Note that you must use
inline('...','t','y'), despite the fact that the
functions do not depend on t.
To plot the vector field for y1 between -6 and 5 and y2 between -6 and 1 type
We now want to plot the trajectory through a point (a1,a2), say (a1,a2)=(1,-3):
vectfield(g,-6:.5:5,-6:.5:1)
a1=1; a2=-3
To plot a trajectory in the phase
plane starting at a point (a1, a2) at
time t=0 for increasing values of t going from 0 to
4 type
[ts,ys] = ode45(g,[0,4],[a1;a2]);
plot(ys(:,1),ys(:,2))
To plot the trajectory in the phase plane starting at the point
(a1, a2) at time t=0 for
decreasing values of t going from 0 to -4 type
[ts,ys] = ode45(g,[0,-4],[a1;a2]);
plot(ys(:,1),ys(:,2))
To get an idea of the behavior of the ODE, we plot the direction
field and several trajectories together: We can choose e.g. the 35
starting points (a1, a2) with
a1=-7,-5,-3,-1,1,3,5 and a2=-7,-5,-3,-1,1. From each
of those points we plot the trajectory for t going from 0 to 4 and
for t going from 0 to -4:
vectfield(g,-6:.5:5,-6:.5:1)
hold on
for a1=-7:2:5
  for a2=-7:2:1
    [ts,ys] = ode45(g,[0,4],[a1;a2]);
    plot(ys(:,1),ys(:,2))
    [ts,ys] = ode45(g,[0,-4],[a1;a2]);
    plot(ys(:,1),ys(:,2))
  end
end
hold off
These commands will generate a number of warning messages (since some solutions don't exist for t in the whole interval [-4,4]) which you can ignore. You can use the command
warning('off','MATLAB:ode45:IntegrationTolNotMet')
at the beginning of your m-file to suppress these warnings. Then
your code should run without any warnings or errors.
From the picture it appears that there are three critical points: A stable node, an unstable node, and a saddle point.