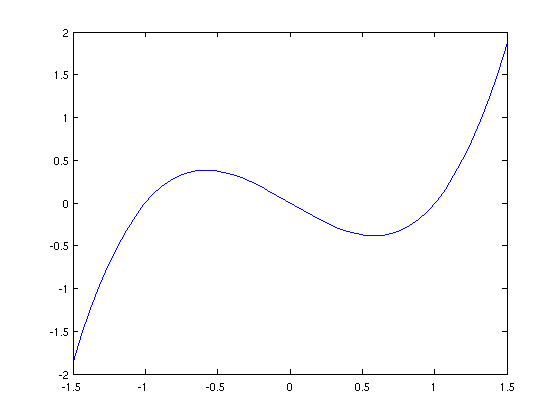
ezplot('x^3-x',[-1.5,1.5])
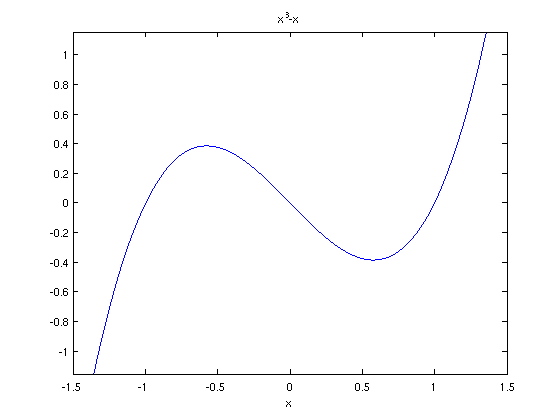
x = linspace(-1.5,1.5,50);  % can also use  x = -1.5:.1:1.5;
                            % don't forget semicolon
plot(x,x.^3-x)              % we need .* ./ .^ for vectors
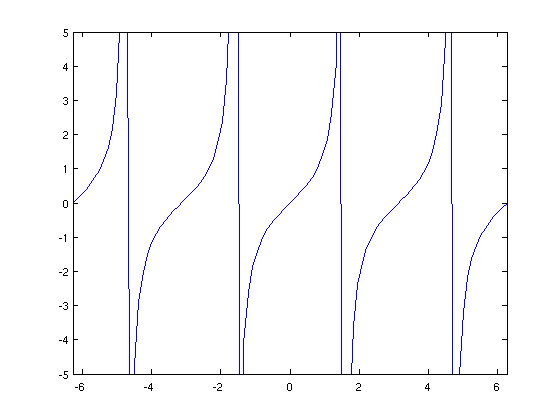
ezplot('tan(x)',[-2*pi,2*pi])
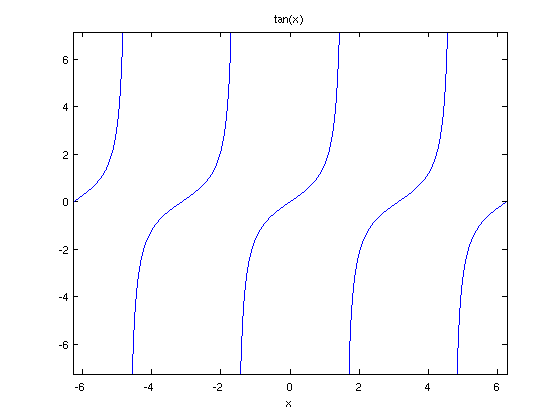
Here we use the axis command to restrict the y-range to -5,5
x = linspace(-2*pi,2*pi,100);
plot(x,tan(x))
axis([-2*pi,2*pi,-5,5])
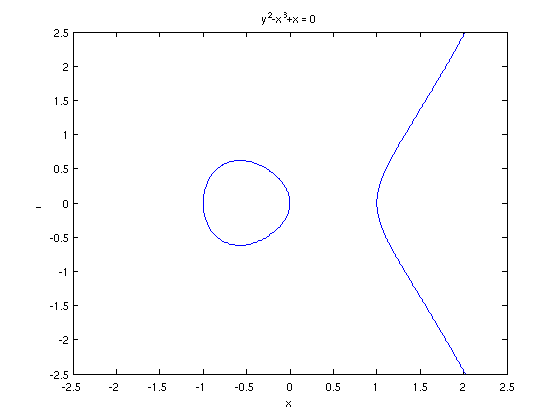
We take the left hand side minus the right hand side, then ezplot plots all points in the (x,y) plane where this is zero.
ezplot('y^2-x^3+x',[-2.5,2.5])