How to draw graphs for linear equations
Contents
You need to download some m-files
Download the following m-files and put them in the same directory with your other m-files:
- plotpoints.m , label.m , fillpoints.m , nice3d.m , stretch.m
format compact % don't print blank lines between results
Plotting a line for an equation in R^2
Consider the set of all (x1,x2) such that 2*x1 + 3*x2 = 6. Plot these points in R^2.
First find a point P=(x1,0) satisfying the equation, this gives (3,0). Then find a point Q=(0,x2) satisfying the equation, this gives (0,2).
Now plot the line through the points P,Q:
P = [3;0]; Q = [0;2];
u = Q - P;                                   % direction vector of line
plotpoints(P,Q,'o-'); hold on                % this draws only the points between P & Q
plotpoints(P-u,Q+u,'--'); hold off           % this draws a larger part of the line
label(P,'P',Q,'Q')
axis equal; grid on

Plotting a plane for an equation in R^3
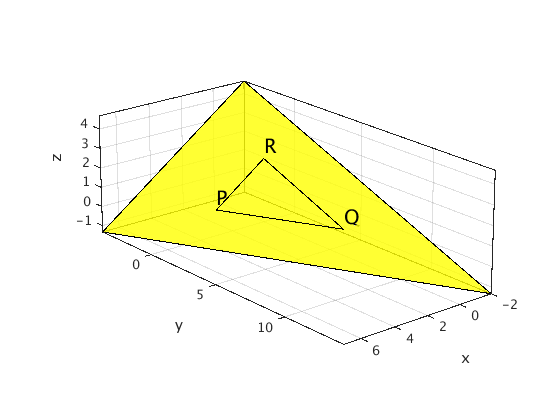
Consider the set of all (x1,x2,x3) such that 2*x1 + x2 + 3*x3 = 6. Plot these points in R^3.
First find a point P=(x1,0,0) satisfying the equation, this gives (3,0,0). Then find a point Q=(0,x2,0) satisfying the equation, this gives (0,6,0). Then find a point R=(0,0,x3) satisfying the equation, this gives (0,0,2).
Now plot the plane through the points P,Q,R:
P = [3;0;0]; Q = [0;6;0]; R = [0;0;2];
fillpoints(P,Q,R,'y'); hold on                % this draws the triangle PQR
fillpoints(stretch([P,Q,R],3),'y'); hold off  % this draws a larger part of the plane
label(P,'P',Q,'Q',R,'R')
nice3d; view(140,20); alpha(0.8)