Example for lines in 2D
Contents
You need to download some m-files
Download the following m-files and put them in the same directory with your other m-files:
format compact % don't print blank lines between results
(1) Plotting a line
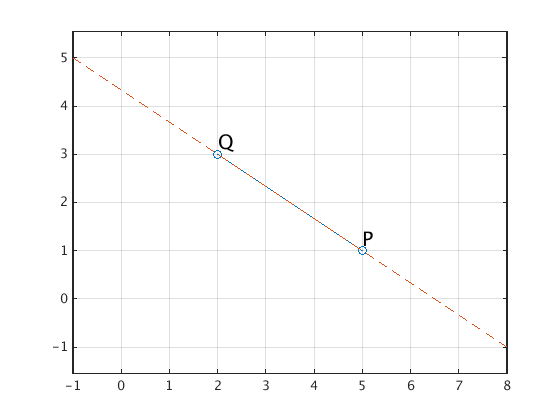
Plot the line segment from (4,1) to (2,3) with a solid line. Then plot a larger part of the line through these two points with a dashed line.
Recall: The points on the line through the points P and Q are given by
P + t*u
where u=Q-P is the direction vector, and t is a real number.
Note that P-u and Q+u are two points on the line which are not between the two points.
P = [5;1]; Q = [2;3];
u = Q - P;
plotpoints(P,Q,'o-'); hold on        % solid line from P to Q, mark points with 'o'
plotpoints(P-u,Q+u,'--'); hold off   % dashed line from P-u to Q+u
label(P,'P',Q,'Q');                  % label points
axis equal; grid on
(2) Plot two line segments
Plot the line segment from (4,1) to (2,3) and the line segment from (3,1) to (2,2).
R = [3;1]; S = [2;2];
plotpoints(P,Q,'o-'); hold on
plotpoints(R,S,'o-'); hold off
label(P,'P',Q,'Q',R,'R',S,'S');      % label points
axis equal; grid on                  % make units in x1 and x2 direction equal, show grid

(3) Find the intersection point of two lines
Find the intersection point of the line through the points (4,1),(2,3) and the line through the points (3,1),(2,2).
Let u=Q-P and v=S-R denote the direction vector of the two lines. Then at the intersection point X we must have
X = P + t1*u = R + t2*v
for some real numbers t1,t2. In other words, the vector t=[t1;t2] satisfies the linear system u*t1 - v*t2 = R - P or
[u,-v]*[t1;t2] = R - P
We can solve this linear system with the backslash command:
v = S - R
t = [u,-v]\(R-P)     % solve linear system with matrix [u,-v] and rhs vector R-P
                     % we obtain t1=2, t2=4
X = P + t(1)*u       % intersection point X
R + t(2)*v           % gives the same intersection point X
v =
    -1
     1
t =
    2.0000
    4.0000
X =
    -1
     5
ans =
   -1.0000
    5.0000
(4) Draw two lines with intersection point X
Consider the infinite lines through the points given in (2). Draw them long enough so that we can see the intersection point X.
Note that we have to plot the points P+t1*u for a range of t1 values which includes t1=2 and the points R + t2*v for a range of t2 values which includes t2=4.
plotpoints(P,Q,R,S,X,'o'); hold on      % mark points with 'o'
label(P,'P',Q,'Q',R,'R',S,'S',X,'X')    % label points
plotpoints(P-0.5*u,P+2.5*u);
plotpoints(R-0.5*v,R+4.5*v); hold off
axis equal; grid on
