Solving the Poisson Equation (Dirichlet case) using the Discrete Sine Transform
Contents
You first have to download m-files
Download the m-files sintr.m , isintr.m and put them in the same directory as your other m-files.
Solve the Poisson equation  in a rectangle
We are given a "forcing function"  for
for ![$x\in [0,A]$](PoissonD_eq06895032831639178498.png) ,
, ![$y\in[0,B]$](PoissonD_eq10287963619840255830.png) . We want to find a function
. We want to find a function  for , such that

We prescribe Dirichlet boundary conditions on all four sides of the rectangle:


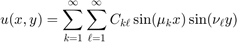
We write the solution as a sine series for both x and y: With  and
and 
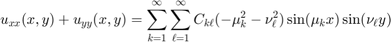
From this we get
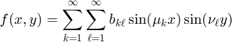
This gives the following Solution Formula: First find the sine series of  for both x and y:
Define for  the coefficients
 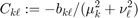 , then the solution is given by the above sine series in x,y.
Example: For a rectangle with lengths  and
and  we are given the forcing function
  .
.
A=3; B=2;                       % lengths of rectangle sides
f = @(x,y) x.*(x-A)+y.*(y-B);   % given forcing function f(x,y)

M = 60;                         % use spacing A/M for x
x = A*(1:M-1)/M;                % only interior nodes
N = 40;                         % use spacing B/N for y
y = B*(1:N-1)/N;                % only interior nodes

[X,Y] = ndgrid(x,y);
F = f(X,Y);                     % F is array of values of f on grid:  F(j,k) = f(x_j,y_k)
bx = sintr(F);                  % apply sine transform to columns
b = sintr(bx')';                % apply sine transform to rows

mu = (1:M-1)*pi/A;              % vector of mu_k
nu = (1:N-1)*pi/B;              % vector of nu_l
[Mu,Nu] = ndgrid(mu,nu);

C = -b./(Mu.^2+Nu.^2);          % solution formula in frequency domain

Cx = isintr(C')';               % apply inverse sine transform to rows
U = isintr(Cx);                 % apply inverse sine transform to columns

surf(x,y,U');                   % make surface plot of solution
xlabel('x'); ylabel('y'); title('u(x,y)')
view(-15,30);
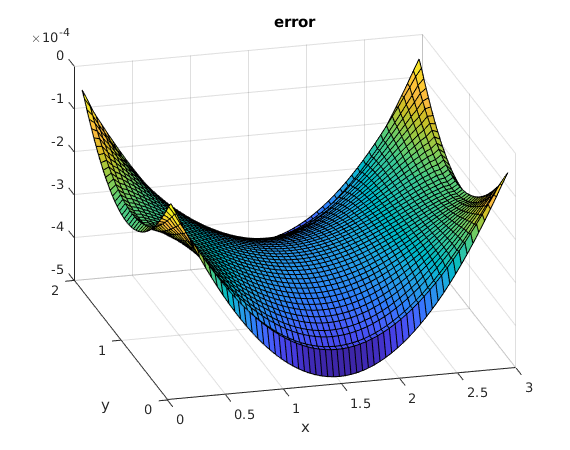
Plot error
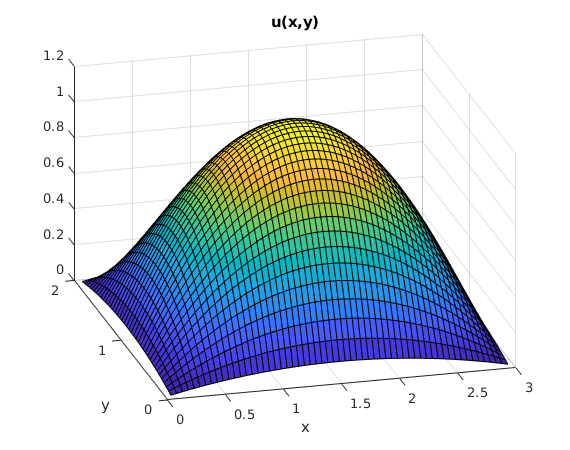
In this case we actually know the exact solution  . We can plot the difference of the computed solution and the exact solution, and we see that the error is of the order
  . We can decrease the error by using higher values of
  .
.
Uex = X.*(A-X).*Y.*(B-Y)/2;           % evaluate exact solution on grid
surf(x,y,(U-Uex)');                   % make surface plot of U-Uex
xlabel('x'); ylabel('y'); title('error')
view(-15,30);