MATH/CMSC 206 - Introduction to Matlab
| Announcements | Syllabus | Tutorial | Projects | Submitting |
Function M-files Part 2
Contents
What Can We Do with a Function M-File?
Try the following with your HowLong.m function:
syms x;
diff(HowLong(x))
ezplot(HowLong(x),[0,100])
ans =

5/(49*((10*x)/49)^(1/2))
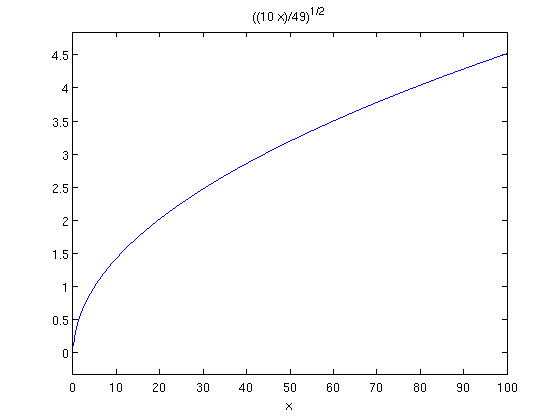
Looks good, yes? Matlab has no problem here because HowLong(x) returns a symbolic expression and both diff and ezplot are perfectly happy with this.
On the other hand the following will result in an error:
| pwise(f) |
What's the error? We saw it in the last lesson, that pwise doesn't know what to do with an unknown x. For the exact same reason we cannot apply either diff or ezplot to pwisef(x).
We should note here that the idea that we cannot differentiate pwisef shouldn't bother us as it's a strange function anyway but we should certainly be able to plot it by just plugging in a bunch of values. We cannot do this with ezplot, instead we'll need to use plot as we'll see soon.
Vectorize Your Function M-File!
If we wish to be even more daring we can vectorize our function M-file. Remember this means we'd like our function to work on vectors as well as just values. There are a variety of ways to do this but we'll look at the one which teaches us the most about programming. Let's first vectorize HowLong:
|
edit vectHowLong.m |
Enter the following code. Some of the structures here should bring back fond memories from the programming lesson.
|
function t=vectHowLong(h) for i=1:length(h) t(i)=sqrt(h(i)/4.9); end end |
Before trying this out read through it and make sure it makes sense. The variable h can now be a vector. The for loop goes from 1 to the length of the vector which is obtained with length(h). Each entry h(i) is stuffed into sqrt(h(i)/4.9) and the result is placed into the correct entry t(i) in the new vector t. Now we can do:
vectHowLong([1:0.5:3])
ans =

  Columns 1 through 3

   0.319438282499970   0.391230398217976   0.451753951452626

  Columns 4 through 5

   0.505076272276105   0.553283335172488
And don't forget that since single numbers are really 1x1 matrices we can still use vectHowLong on a number:
vectHowLong(10)
ans =

   1.010152544552211
Now let's create a vectorized version of our more complicated M-file function and do something fancy with it:
|
edit vectpwisef.m |
Place the following code:
|
function z=vectpwisef(x) for i=[1:length(x)] if (x(i)<=0) y(i)=-x(i); else y(i)=sin(x(i)); end z=y; end |
The really nice thing about having a vectorized version is that it's now easy to plot the function using the plot command. Remember that ezplot won't work if we simply try to apply it to pwisef.
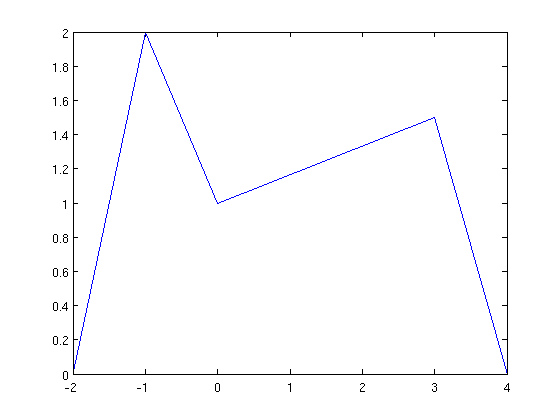
The plot command does many things (it's more flexible than ezplot) but one very basic thing is to plot a set of points and connect them by lines. The points are passed to the command as a vector of x-values and a vector of y-values. Here's an easy example. Suppose we wanted to plot the points (-2,0), (-1,2), (0,1), (3,1.5), (4,0). We'd do the following:
X=[-2 -1 0 3 4];
Y=[0 2 1 1.5 0];
plot(X,Y)
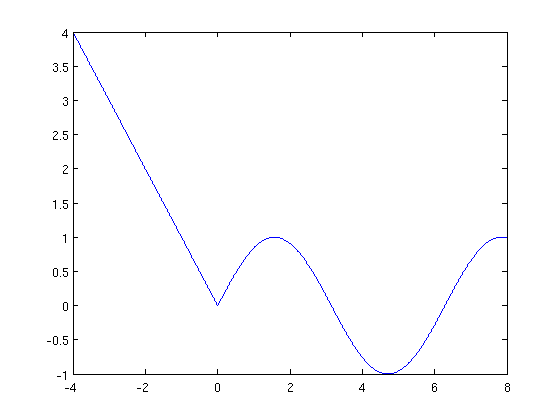
With our piecewise defined function if we want to plug in all values from -4 to 8 in steps of 0.01 and then connect the results we simply do the following. Notice how we use the vector creation trick from earlier:
A=[-4:0.01:8];
plot(A,vectpwisef(A))
Function M-Files with Multiple Arguments
Function M-files can take more than a single variable as an argument. For example suppose we wish to write a function which calculates the area of a rectangle with length l and width w. We can do this with the following code placed in a function M-file called rectarea.m:
|
function a=rectarea(l,w) a=l*w end |
Easy! Then we call the function as expected:
rectarea(15,72)
ans =

        1080
Passing Functions to Functions
The last thing we want to look at is how to pass a function to a function M-file as one of its arguments. For example suppose you wished to write a function M-file which took two arguments, one being a function and the other a constant, and then it plugged the constant into the function and returned the result. Nothing sophisticated!
We do this in a fairly obvious way. The thing to keep in mind is that Matlab can accept functions as parameters in various ways. Here are a couple. First create the M-file plugin:
|
function r=plugin(f,x) r=f(x); end |
This is it. Now we can pass any function as the first argument f provided that f(x) makes sense. For example:
f = @(x) x^2-3;
plugin(f,-1)
ans =

    -2
or:
g = inline('exp(x)+x');
plugin(g,1.2)
ans =

   4.520116922736547
In these examples both f(-1) and g(1.2) make sense within plugin so Matlab proceeds with no trouble.
Documenting Your M-File
To close this section we'll put in a vote for a good programming practice - documentation! At the Matlab prompt we can always type help name to get information on command like help ezplot. Now that we've learned to write function M-files we should put some documentation in those files so that we can get help on them. Modify your rectarea.m file to read:
|
function a=rectarea(l,w) % This function rectarea(l,w) finds the area of a rectangle with % length l and width w. a=l*w end |
Then try:
help rectarea
  This function rectarea(l,w) finds the area of a rectangle with
  length l and width w.
The text which is after the % symbols in the M-file will be printed out as a response to help rectarea being called.
Self-Test
- Write a function M-file defining a vectorized function adjust which accepts a vector v. For each positive entry in v that entry is squared. For each negative entry in v that entry is converted to the negative square root of its absolute value. Entries which are zeroes are left alone.
- Write a function M-file defining a vectorized piecewise function piece which accepts a variable x. If x>=0 the function returns cos(x) and if x<0 the function returns exp(x)*cos(x). Then use plot to graph this function on an interesting interval.
- Write a function M-file defining a function exparea of two variables a and b which returns the area below the graph of exp(x) from x=a to x=b. Put some documentation in the function which explains what the function does.
- Write a function M-file defining a function badlimit which takes a function f and an x-value x and approximates the limit of f(x) at x by pluggin in a value very close to x.