MATH/CMSC 206 - Introduction to Matlab
| Announcements | Syllabus | Tutorial | Projects | Submitting |
Plotting Curves
Contents
Using ezplot
A picture is worth 1000 words. Let's learn how to get Matlab to show us some graphs. The easiest way is to use a command called ezplot. Suppose you want to draw the graph of the function f(x)=sin(x) over the interval from -pi to pi. Try typing the following command:
syms x
ezplot(sin(x), [-pi, pi])
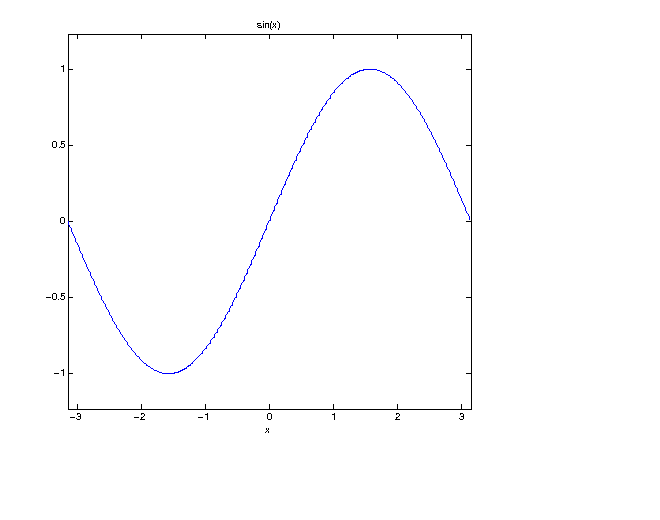
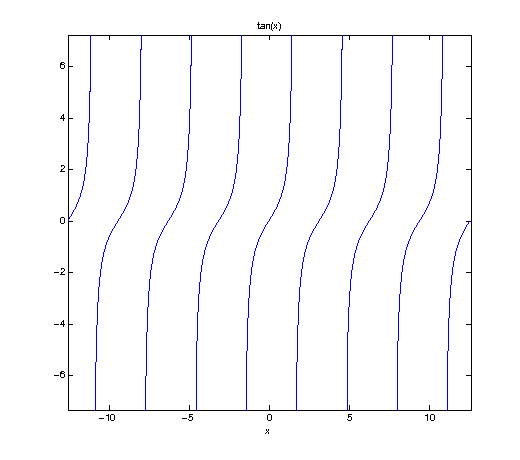
After executing the ezplot command, you should see a small window pop up containing a graph that looks like the image above. Wow, that was easy! Try a few more:
ezplot(tan(x), [-pi * 4, pi * 4])
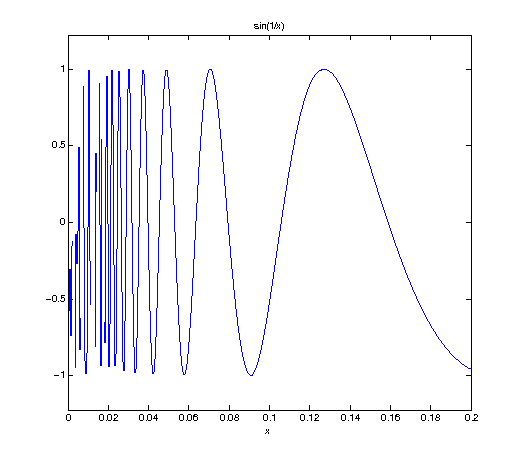
How about this one:
ezplot(sin(1/x), [0, 0.2])
Try some of your own!
There is an alternative function called plot that gives you much more flexibility and options with your graphs, but it is a bit more advanced. If you'd like to learn about plot, try reading the Matlab help entry or wait until it turns up later in the tutorial (it does!) Some of it will make more sense after you've learned more about how to use functions in Matlab, which we'll talk about later.
Self-Test
- Have you ever wondered what the graph of the function f(x) = x * sin(x) looks like? Of course you have. Find out using ezplot.
- Suppose you want to find the solutions to the equation 5*x^2 - 125*ln(x) = 0. First try to solve this equation symbolically, using solve. How do you like them apples?
- OK, it looks like you'll probably want to try a numerical method for solving that crazy equation in the previous question. In order to use fzero, you'll need to start with an initial estimate -- but how do you know what value to choose? Use ezplot to draw a graph of this function. Try different ranges until you can see approximately where this graph crosses the x-axis. Now solve the equation with fsolve using the estimated zero obtained visually from the graph.